
Neuralchek HRV scanning in Holladay, UT
What Is HRV and Why It Matters
Heart Rate Variability (HRV) measures the natural fluctuations in the time interval between heartbeats. Rather than being a “problem” to fix, a higher HRV generally reflects the body’s ability to adapt to stress and engage the nervous system’s regulatory processes. HRV is widely used as a wellness metric because it offers insight into how the body is managing stress, recovery, resilience, and overall balance.
Benefits of tracking HRV include:
Insight into stress and recovery dynamics
A snapshot of how the nervous system responds to daily pressures
A tool to support lifestyle, sleep, and wellness decisions
A baseline for evaluating changes over time
Unlike heart rate alone, which tells you how fast your heart is beating, HRV tells you how flexible your nervous system is — and that flexibility is a key indicator many clients use to guide their recovery and wellness practices.
Partnership with the Neuralchek HRV Pulse Analysis
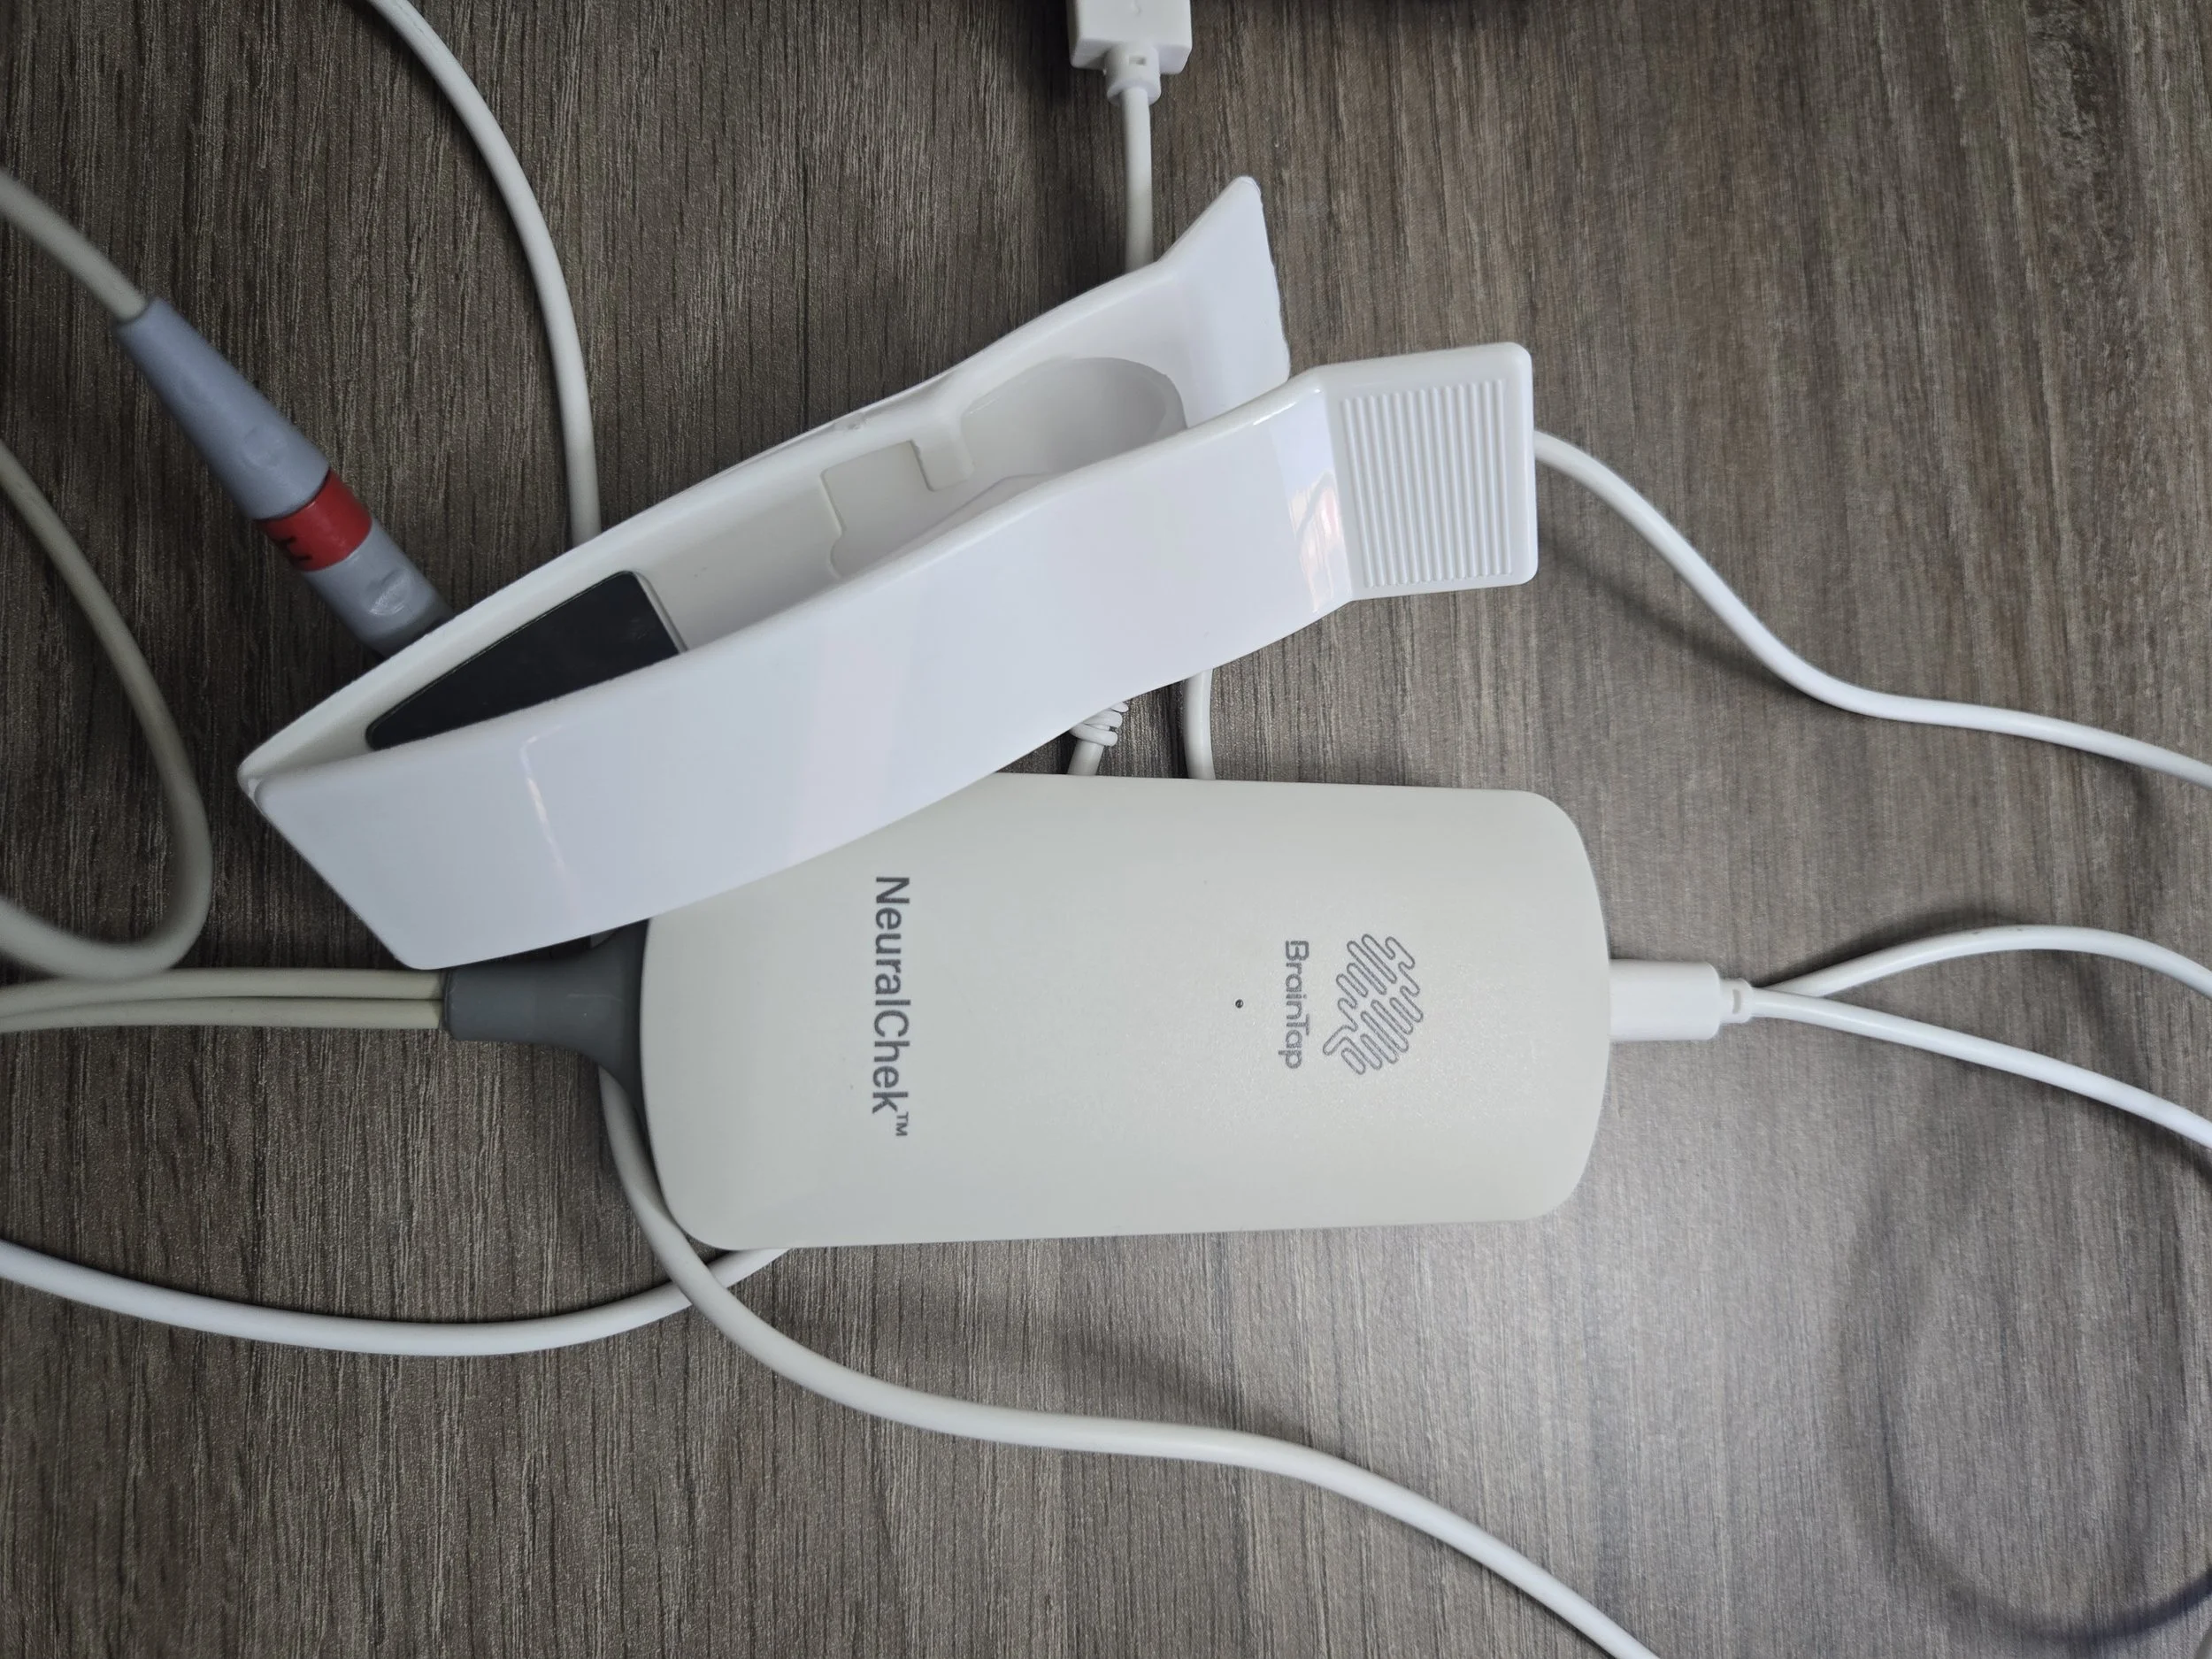
The Neuralchek HRV Pulse Analysis runs a short non-invasive scan that returns a comprehensive report to check stress levels, aging, hormone balance, recovery, and performance.
Key components of the report include:
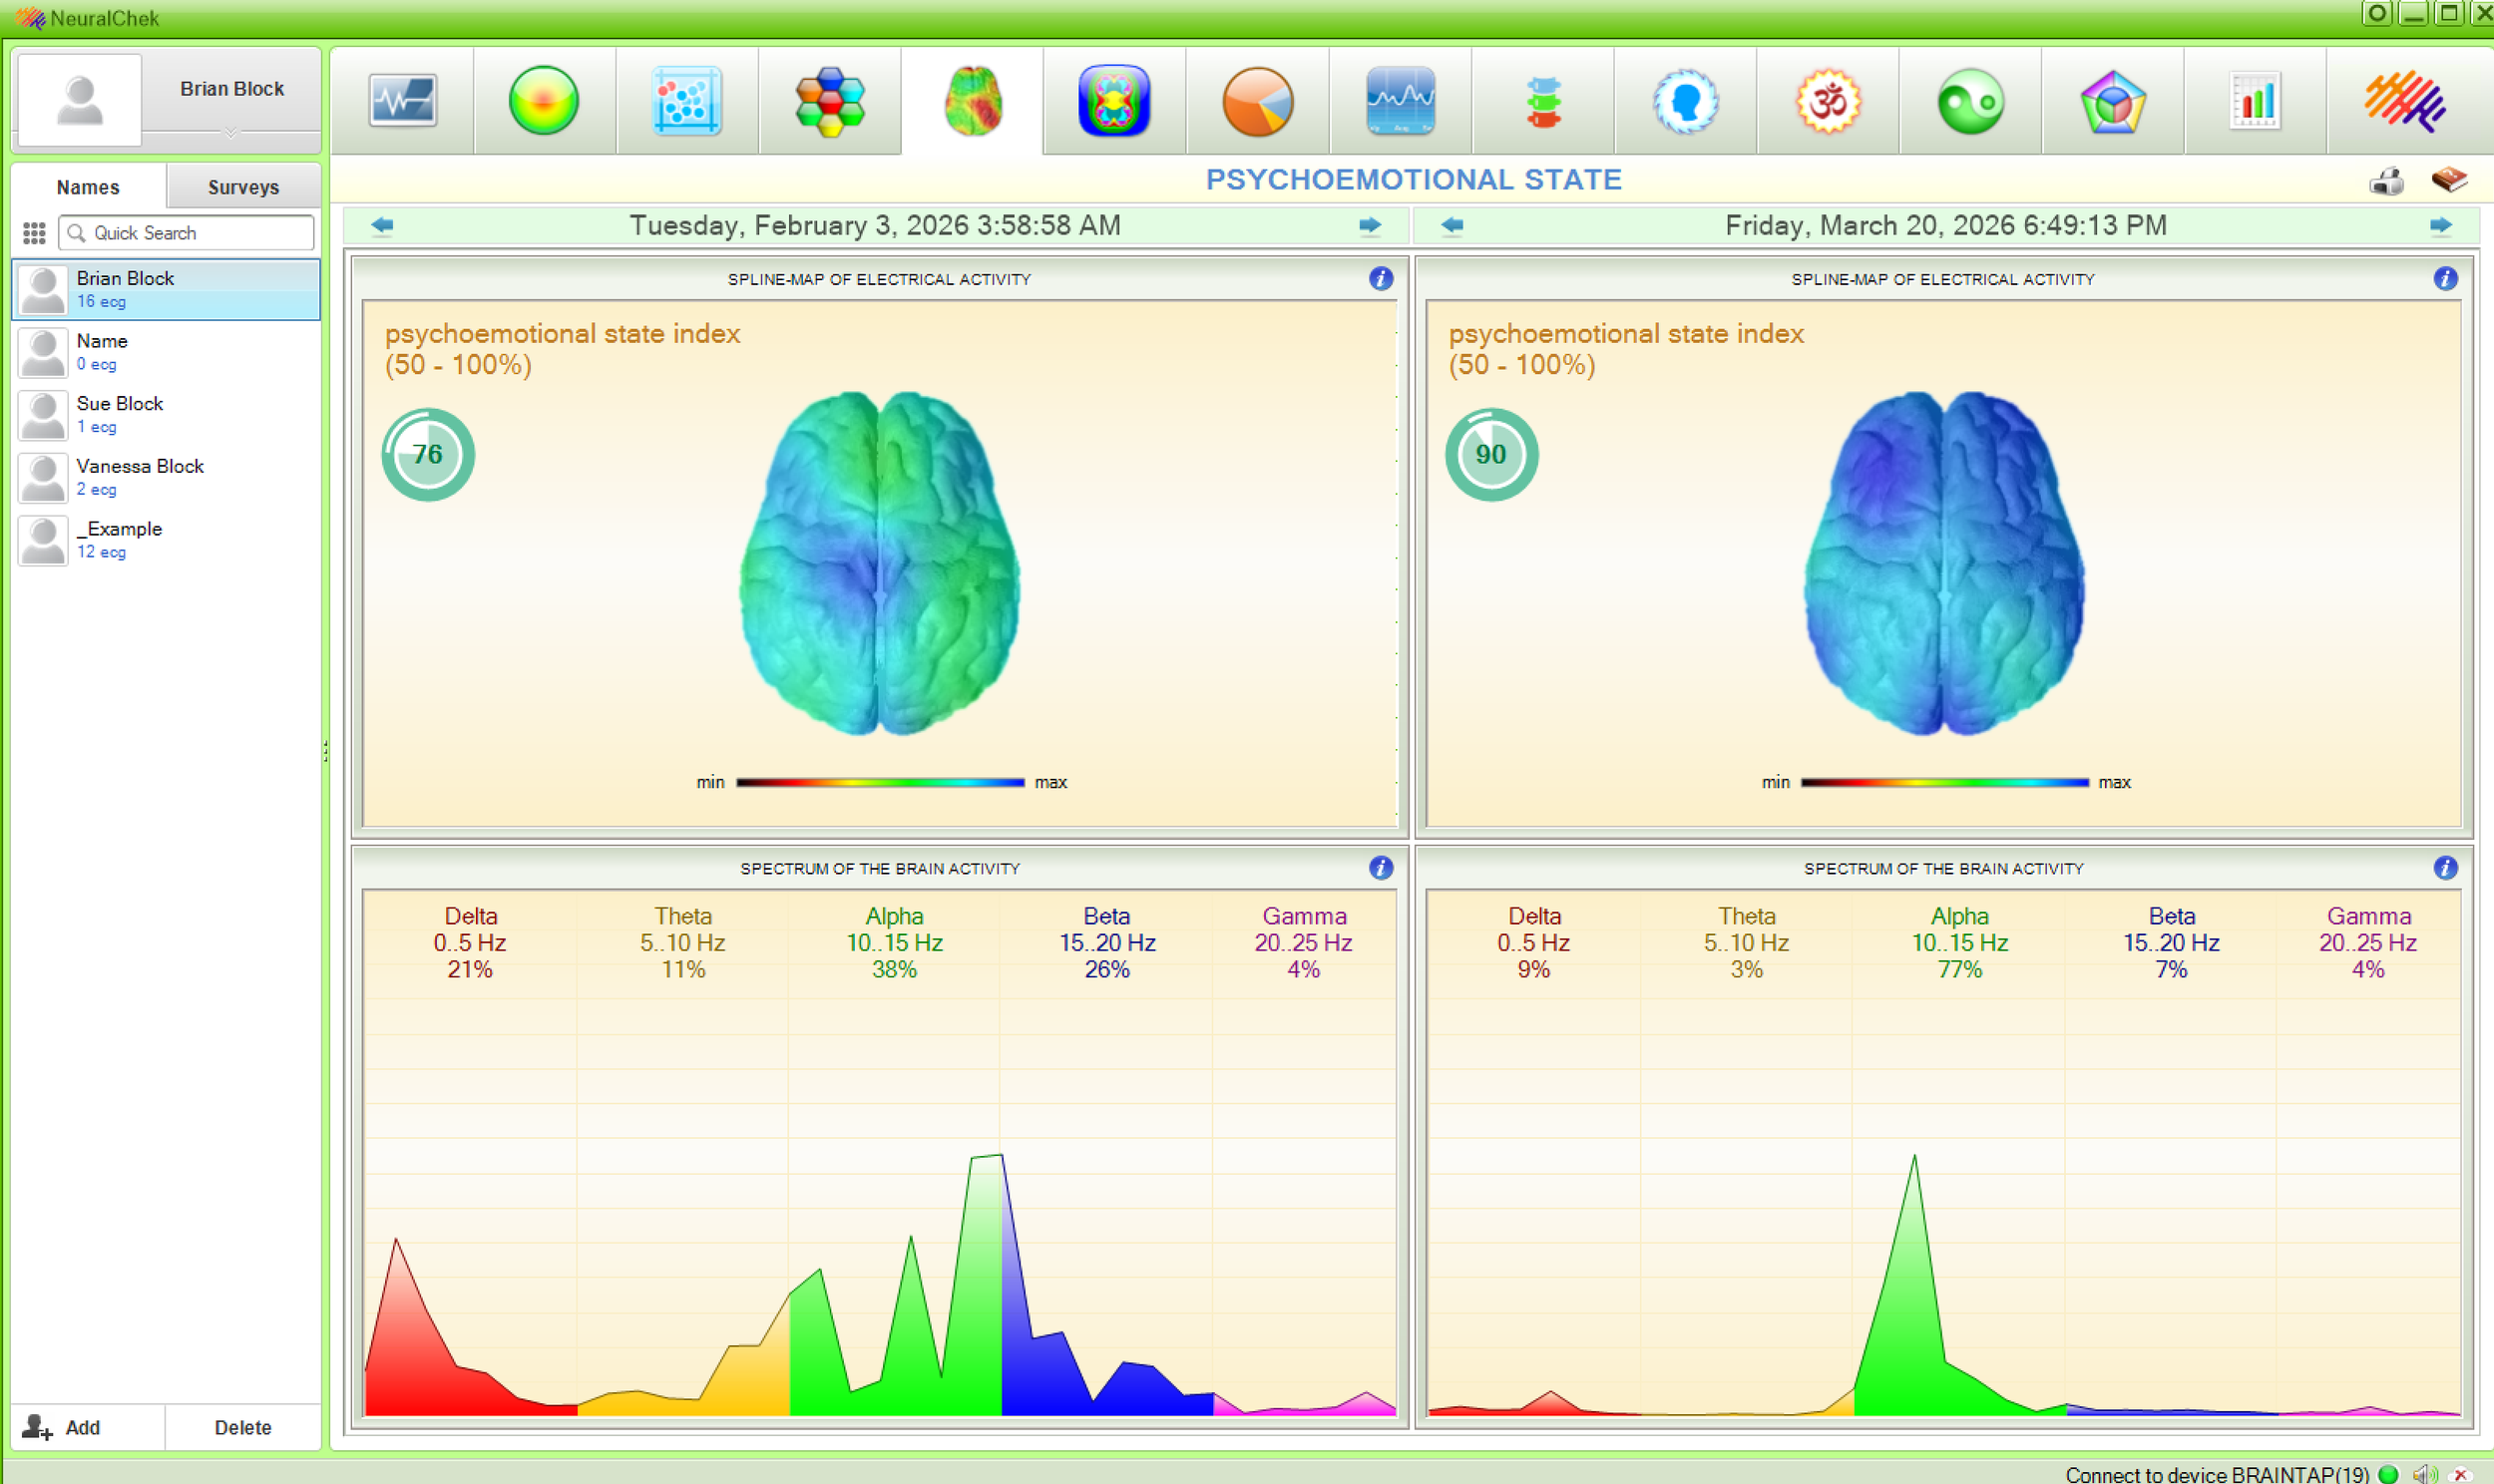
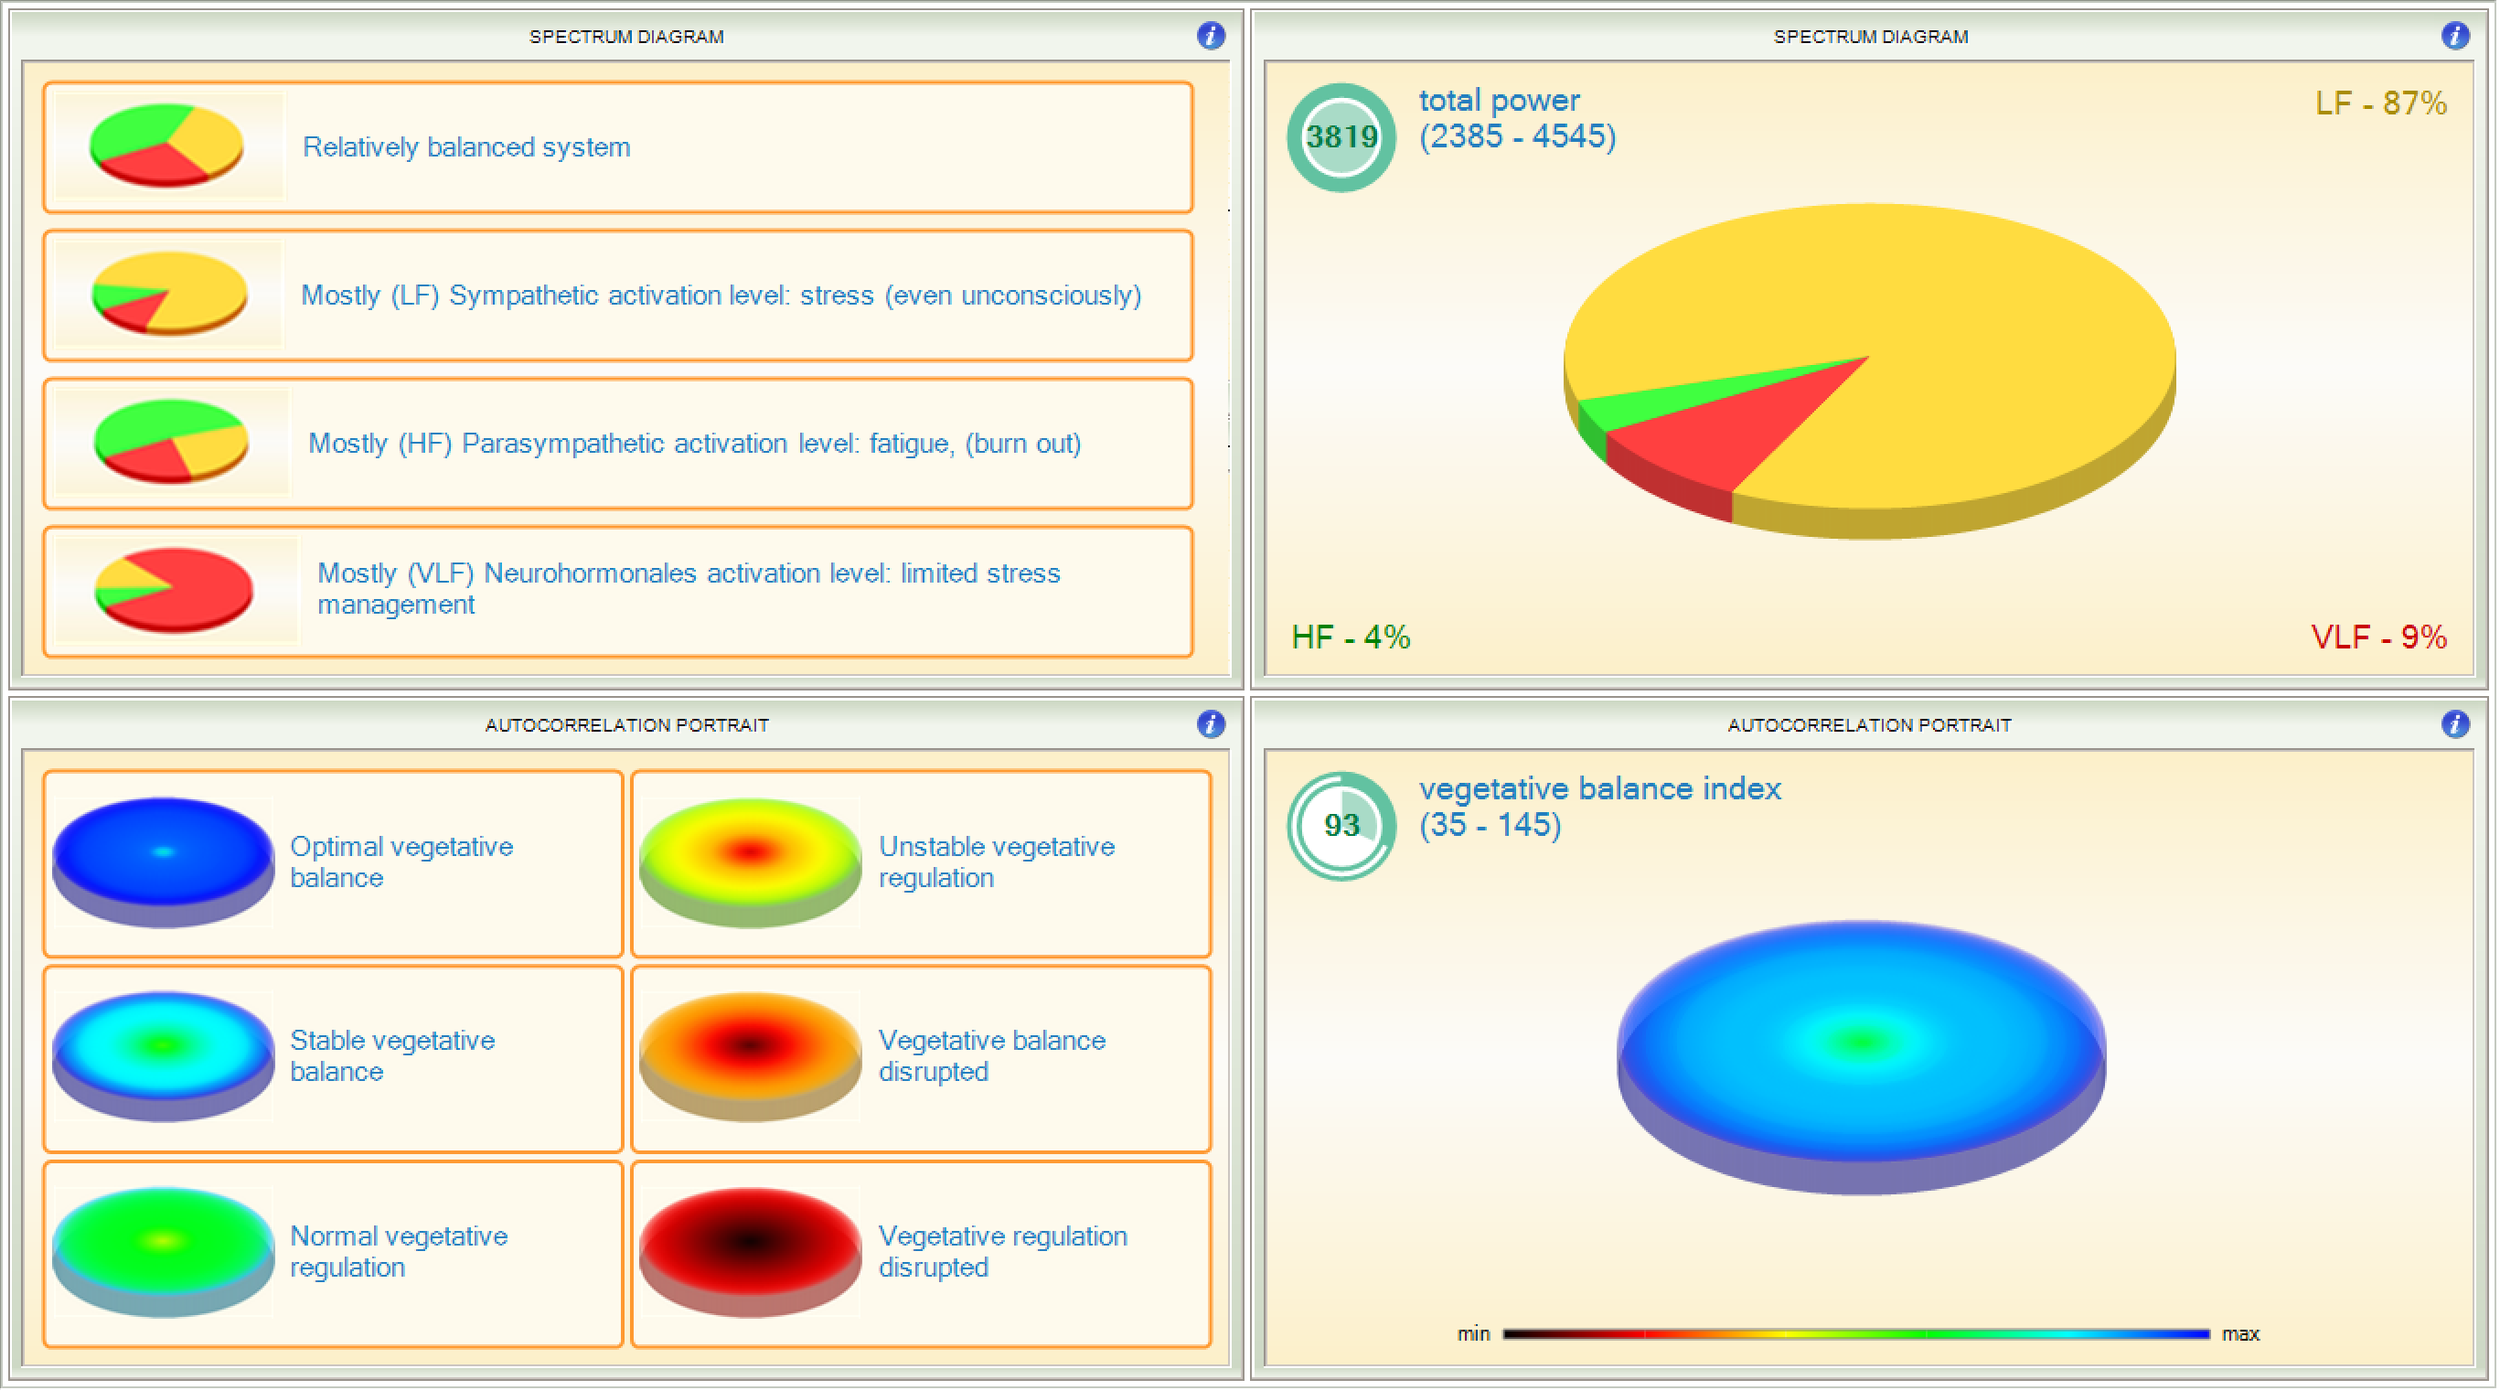
Autonomic Nervous System (ANS) Balance: Measures the functional balance between the sympathetic ("fight or flight") and parasympathetic ("rest and digest") systems.
Stress Index: Evaluates how well your body manages physical, emotional, and environmental stressors.
Biological Age vs. Chronological Age: Compares your actual age to your body’s functional age to identify premature aging.
Energy Levels: Assesses current energy, often identifying potential adrenal exhaustion.
Cardiovascular Adaptation: Measures how well blood vessels contract and dilate, indicating stability in blood pressure
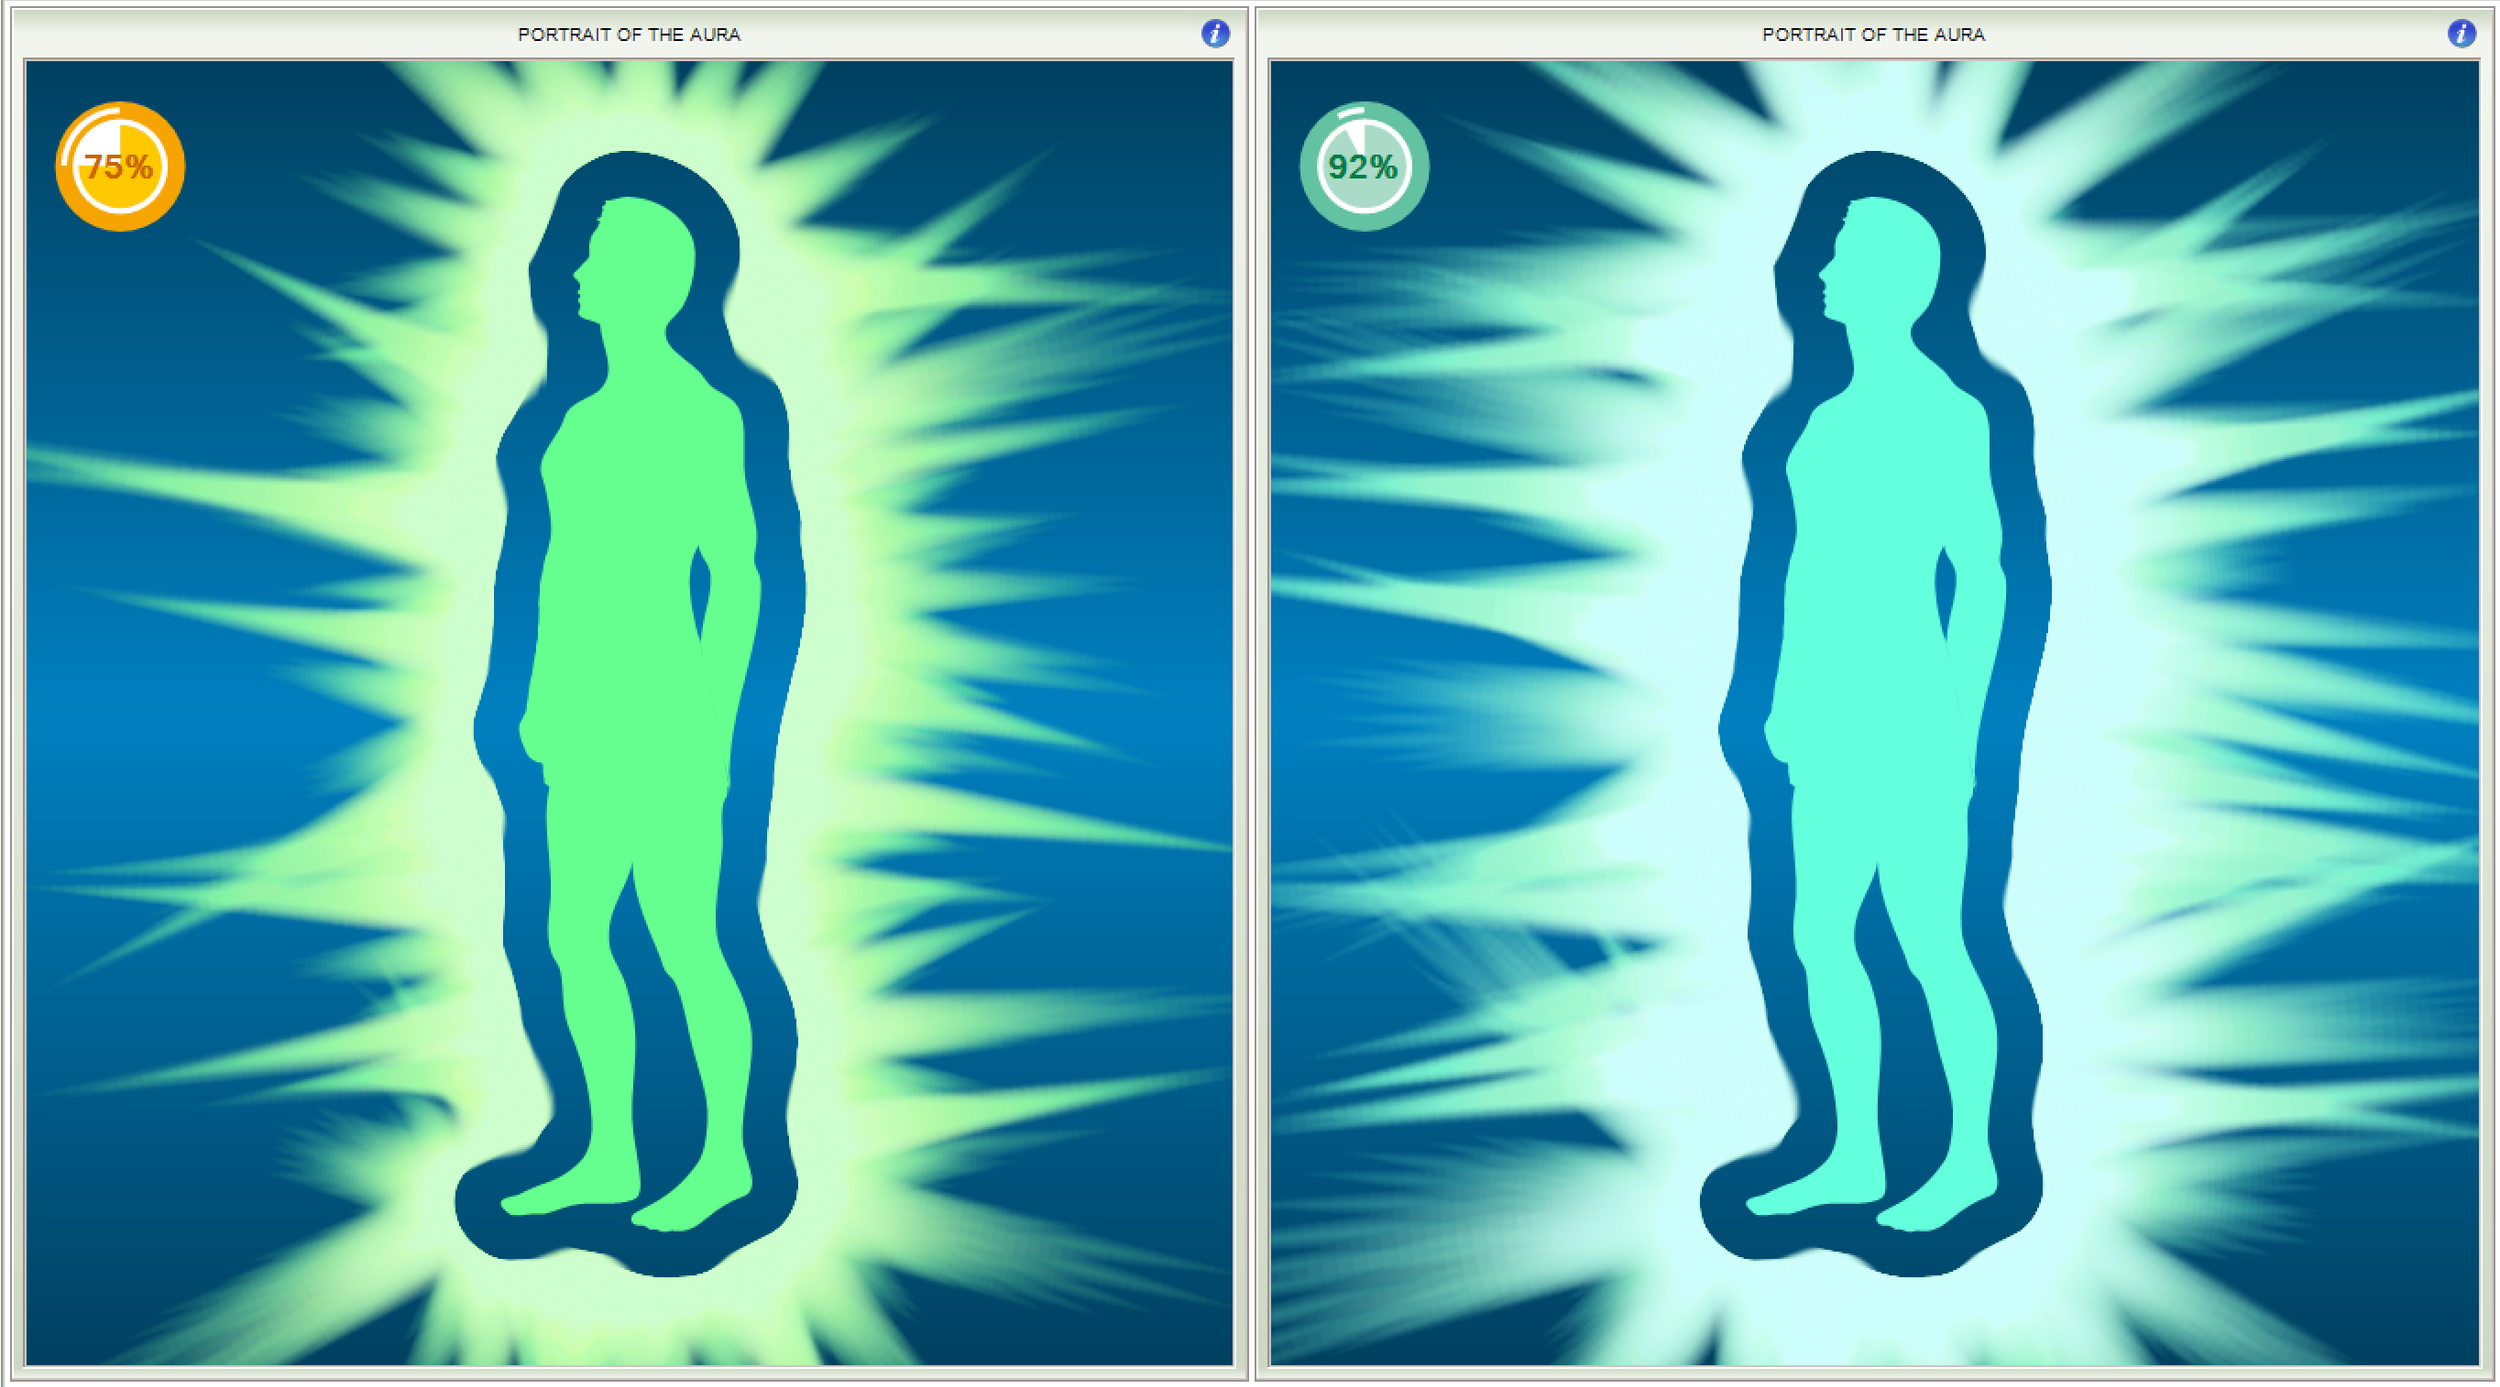
Psycho-emotional State & Chakra Systems: Provides insights into emotional, mental, and sometimes, energy-based systems blend of objective data (HRV) and experiential support (guided audio-visual entrainment) gives you both measurable insights and a supportive wellness experience.
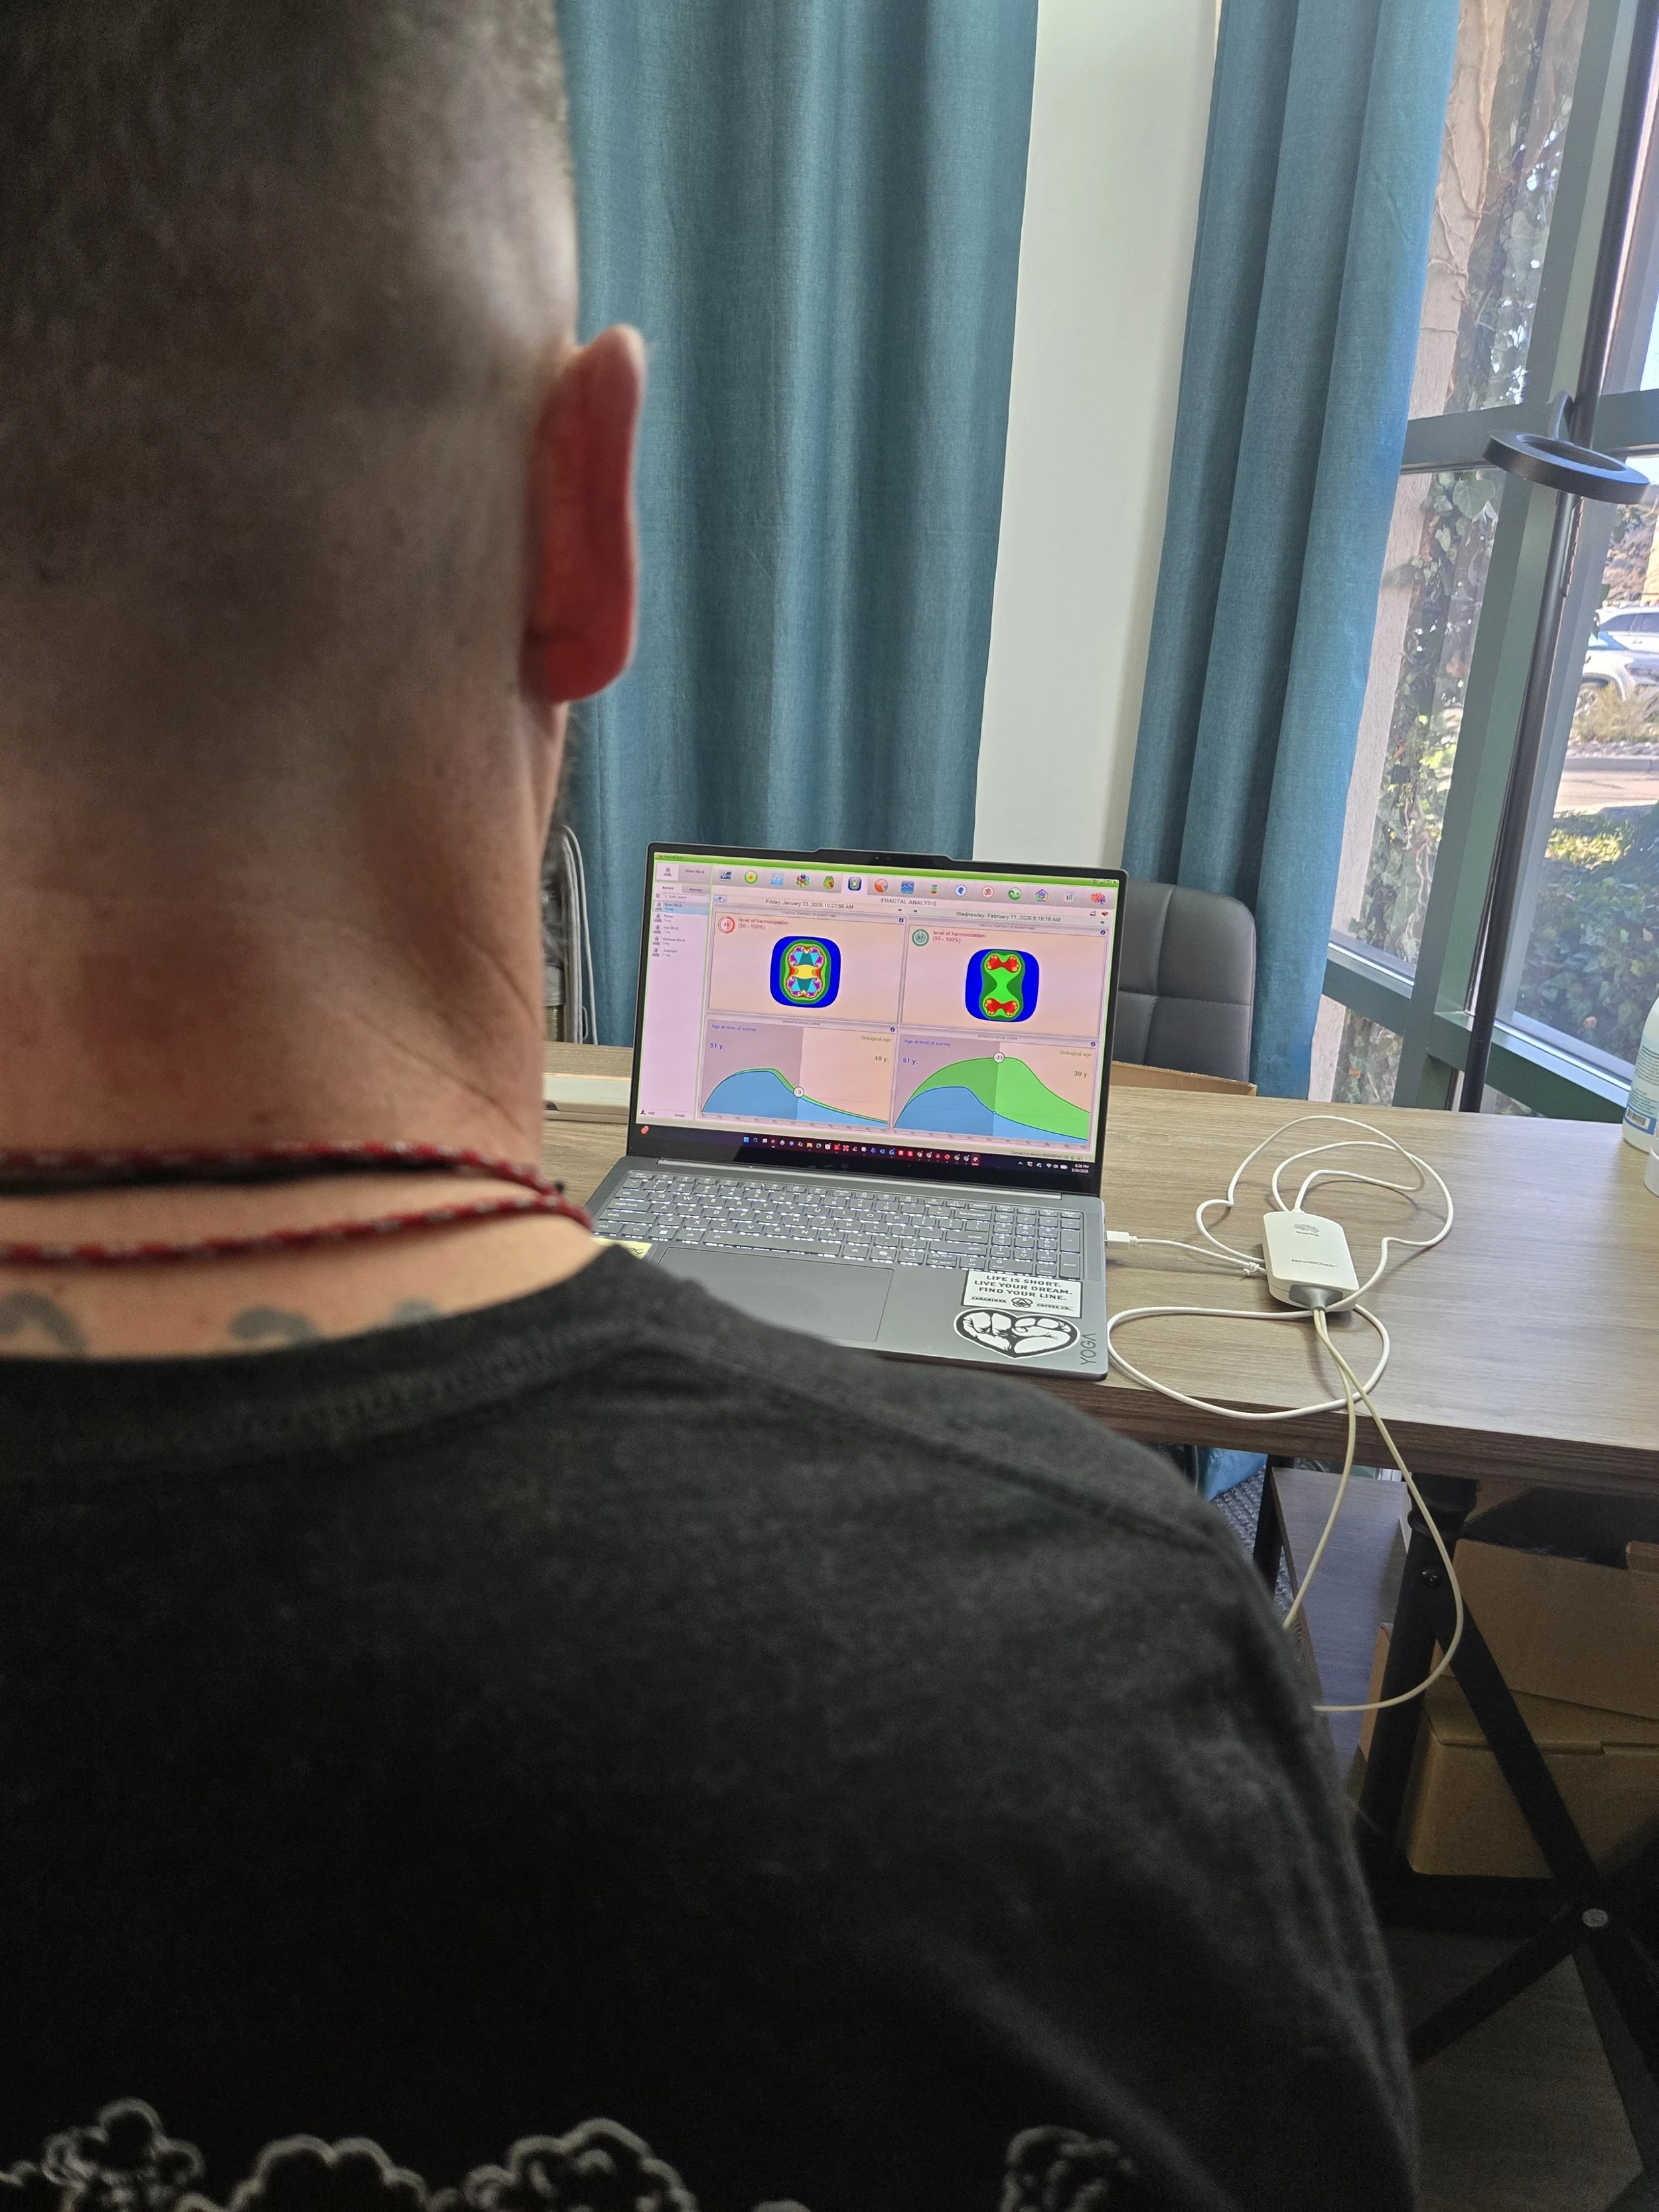
What Happens During an HRV Scan?
Relax in a comfortable seated position. This is a non-invasive technique that only requires access to your wrists.
First, a sensor is placed on each wrist with a conductive material to keep the contact while the test commences.
With feet flat on the floor, you sit still and breathe normally, letting the sensor read your heart rate. There will be a small beeping noise (if desired) to let you know the scan is progressing and when it is complete.
Once the scan concludes, the practitioner will take you through each report and metric.
This first scan will be a benchmark. From there, we can recommend a wellness routine that will best address and support your path. The purpose isn’t to diagnose or treat, but to offer useful information you can use to support daily habits, recovery strategies, and stress regulation goals.
-
No extensive preparation is required. Avoid heavy exercise or caffeine right before a test for the most consistent readings.
-
HRV scans take just a few minutes. If we are sandwiching a two scans and a + BrainTap session, it will be about 20–30 minutes, including baseline measurement and post-session data collection.
-
You remain relaxed and comfortable throughout. The pulse sensor is gentle, and BrainTap sessions are passive — you may notice light shifts in mood, breathing, or calmness.
-
No. HRV measurements and BrainTap sessions are not intended to diagnose, treat, or monitor medical conditions. They provide information that may be useful in understanding patterns of stress and regulation.
-
Many clients benefit from measuring regularly — weekly or monthly — to understand trends over time. Consistency matters more than any single data point.
-
HRV is a wellness indicator, not a clinical health test. It can offer insight into how your body is responding to stress and recovery, but it should not replace medical testing or professional diagnosis.
Test Screens: What are we testing?
Autonomic Nervous System-Learn how your autonomic nervous system is functioning. Is it performing or is your central nervous system working overtime?
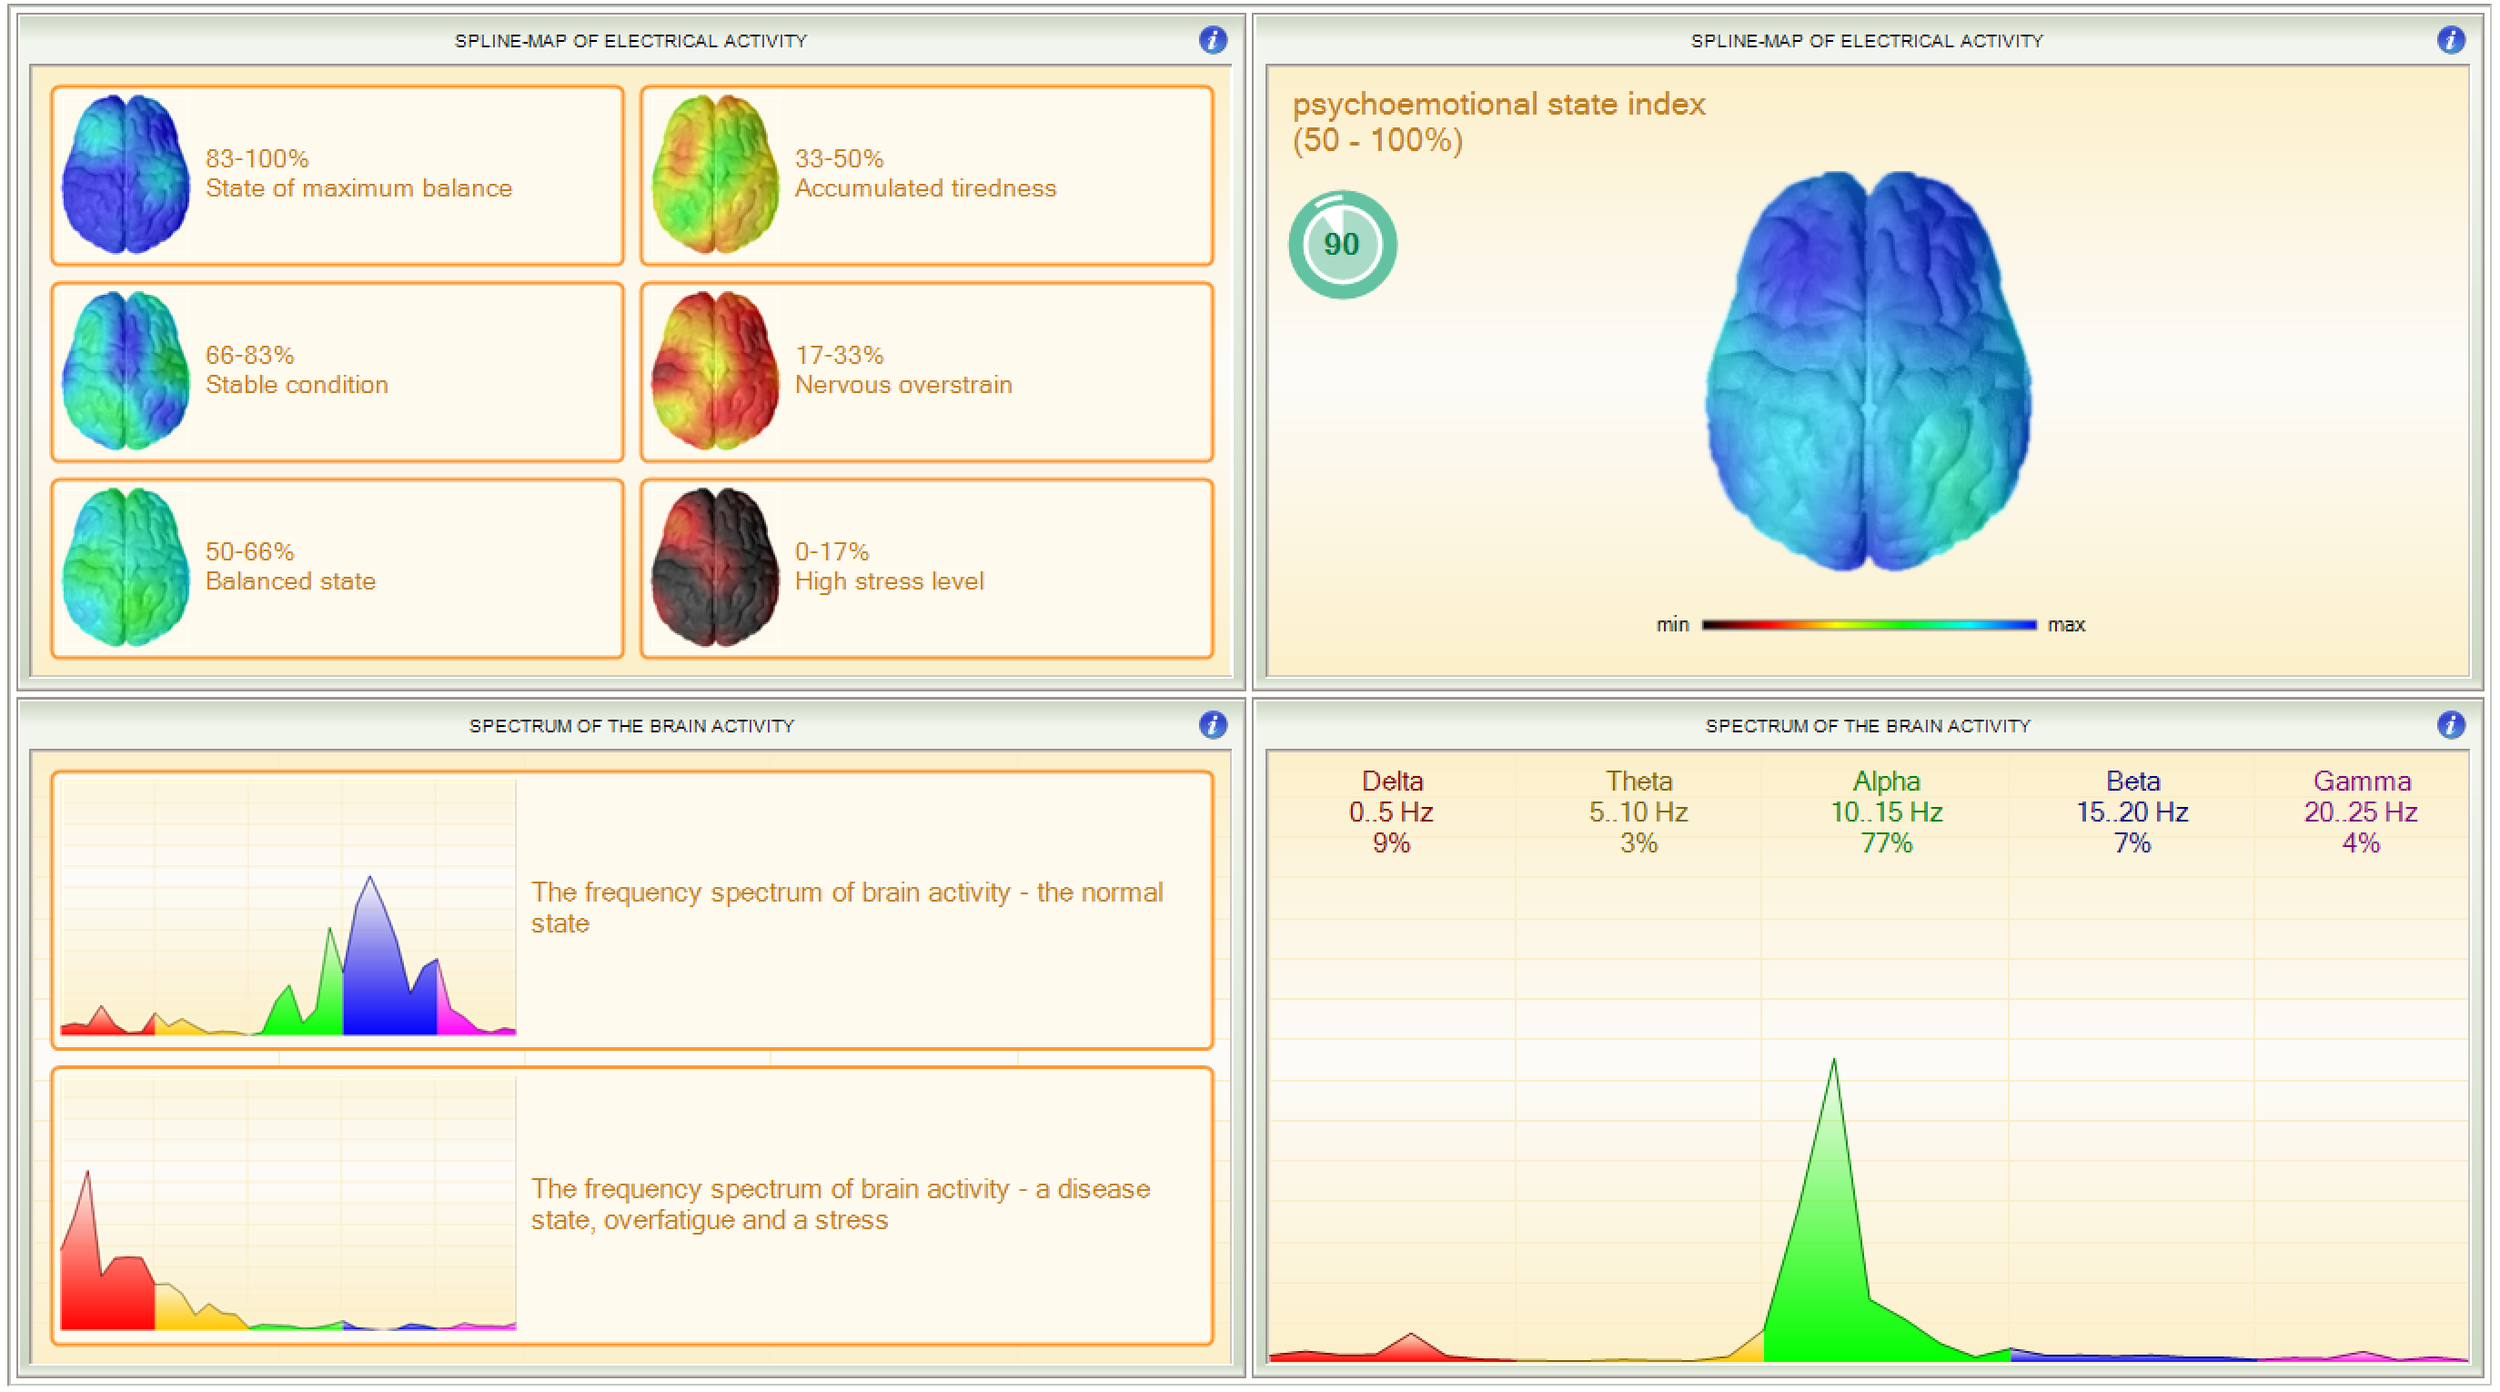
Psycho-emotional State- Learn how stress may be effecting your cognitive function and emotional responses.
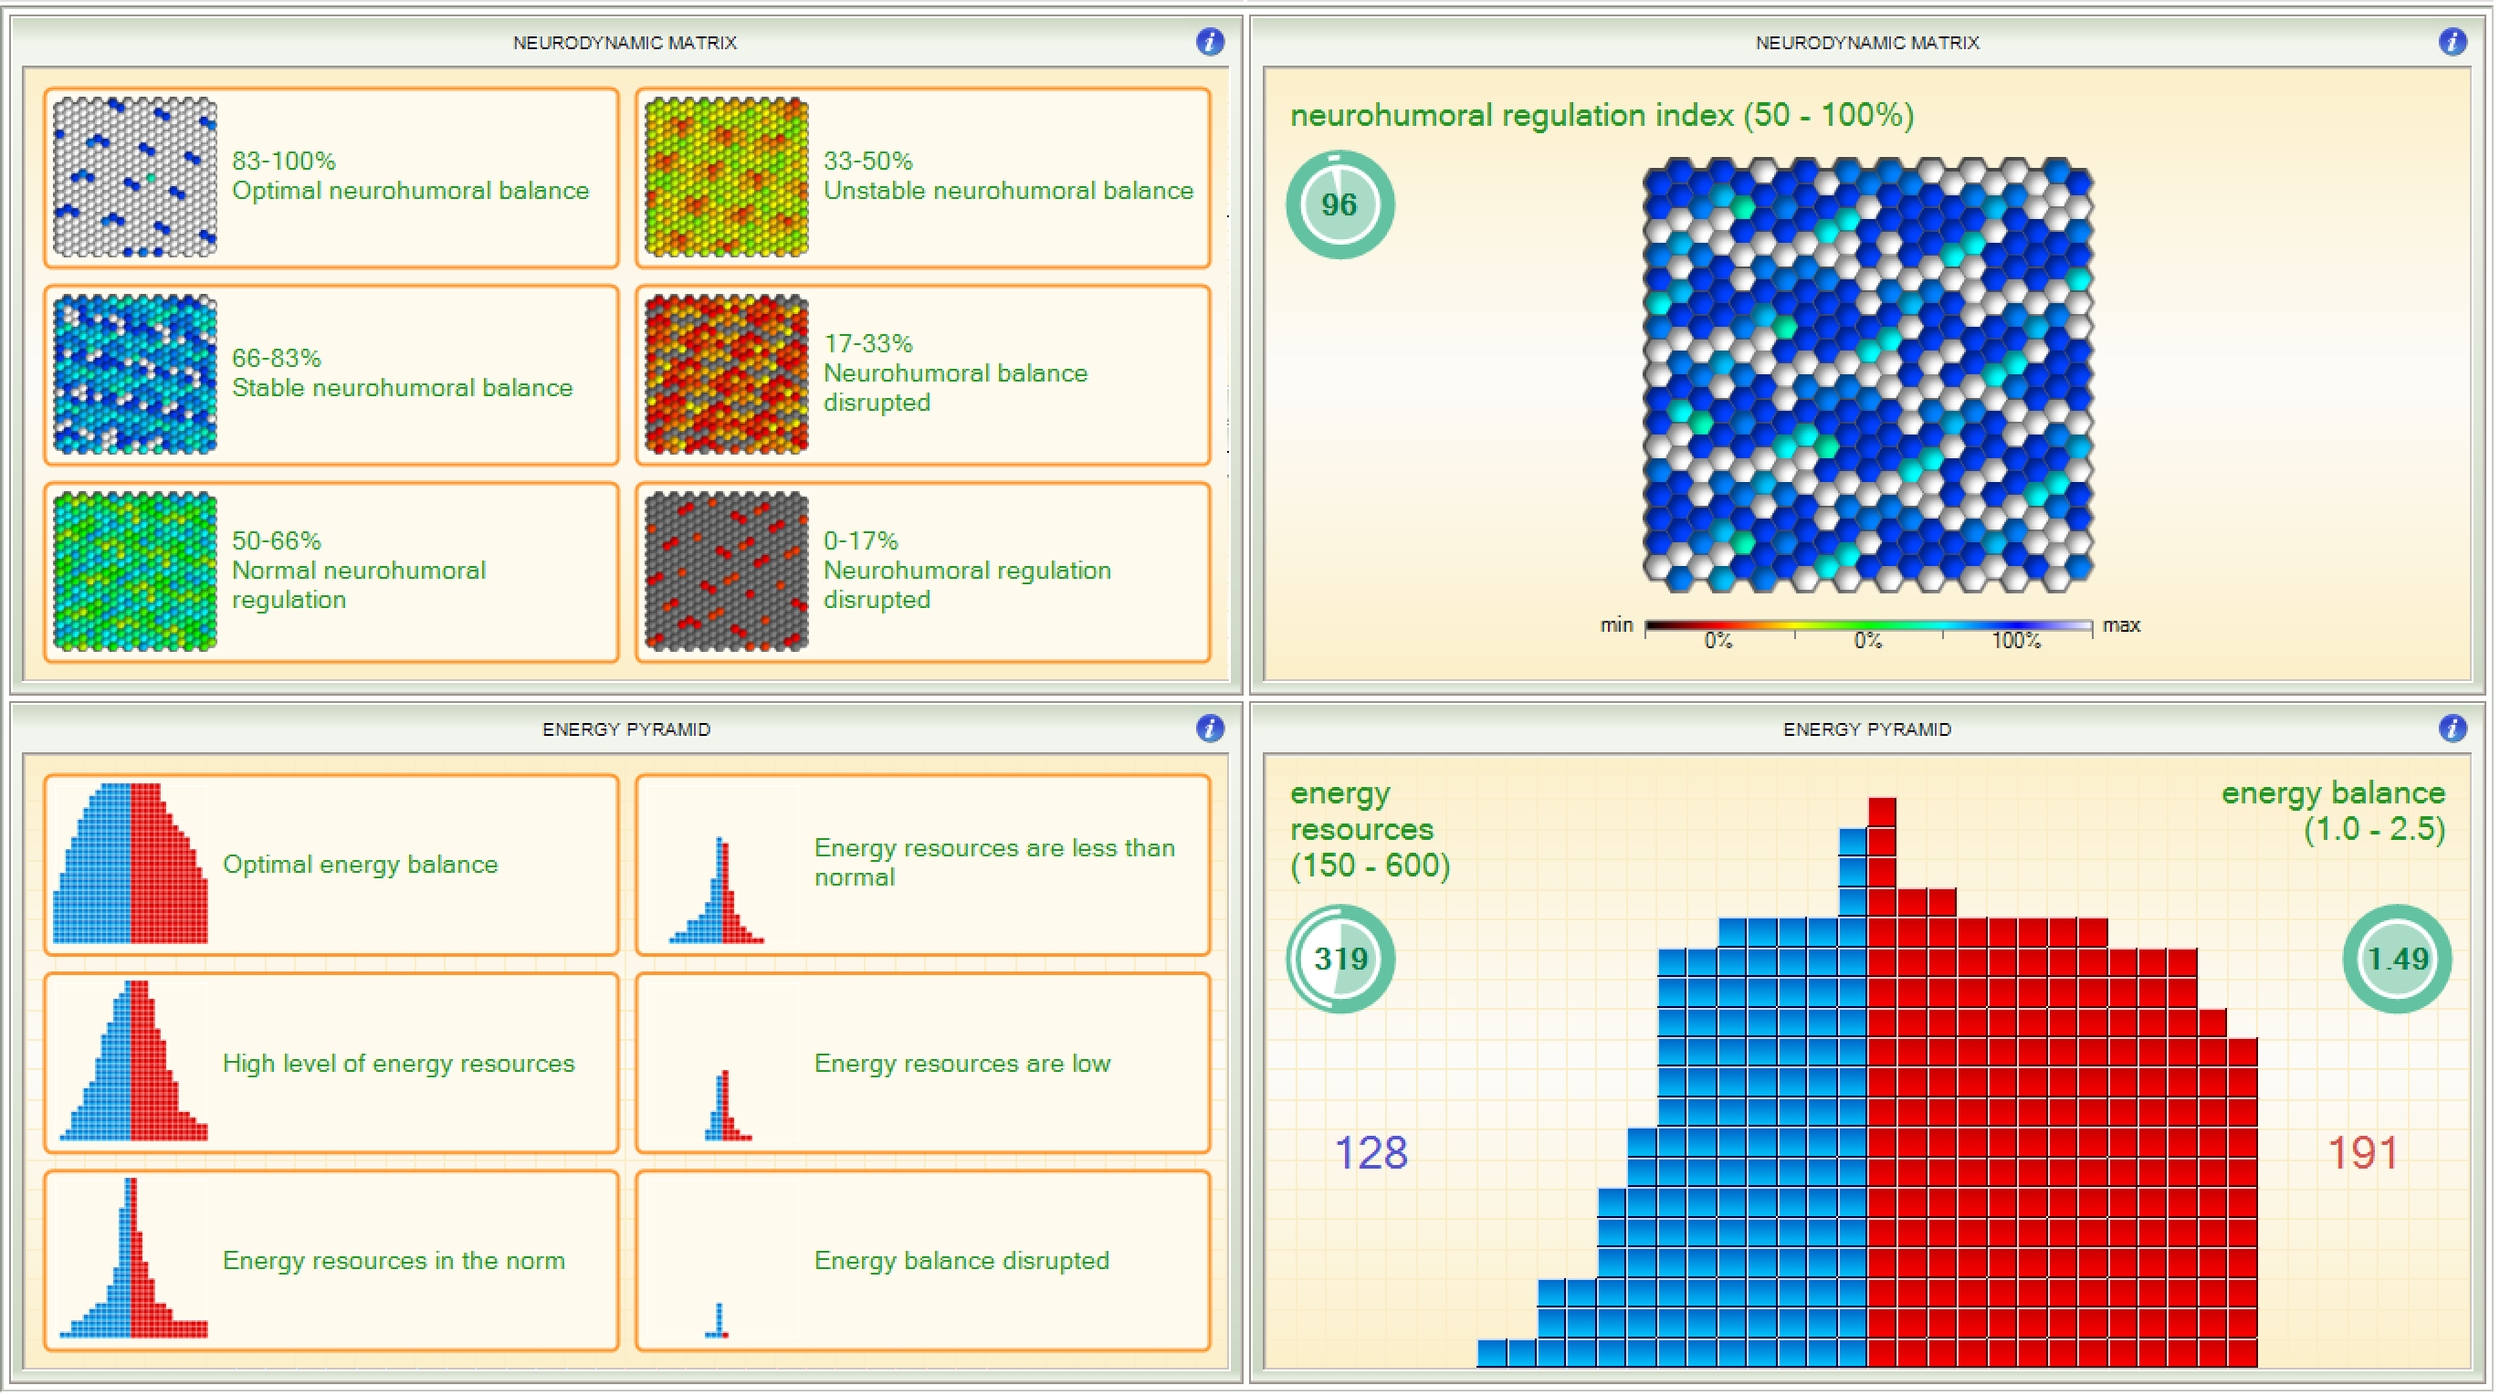
Hormones and Energy- See how your stress is affecting your energy and hormones on a daily basis.
Energy Systems- How is your overall energy effecting your emotional response and actions in the world and daily life?
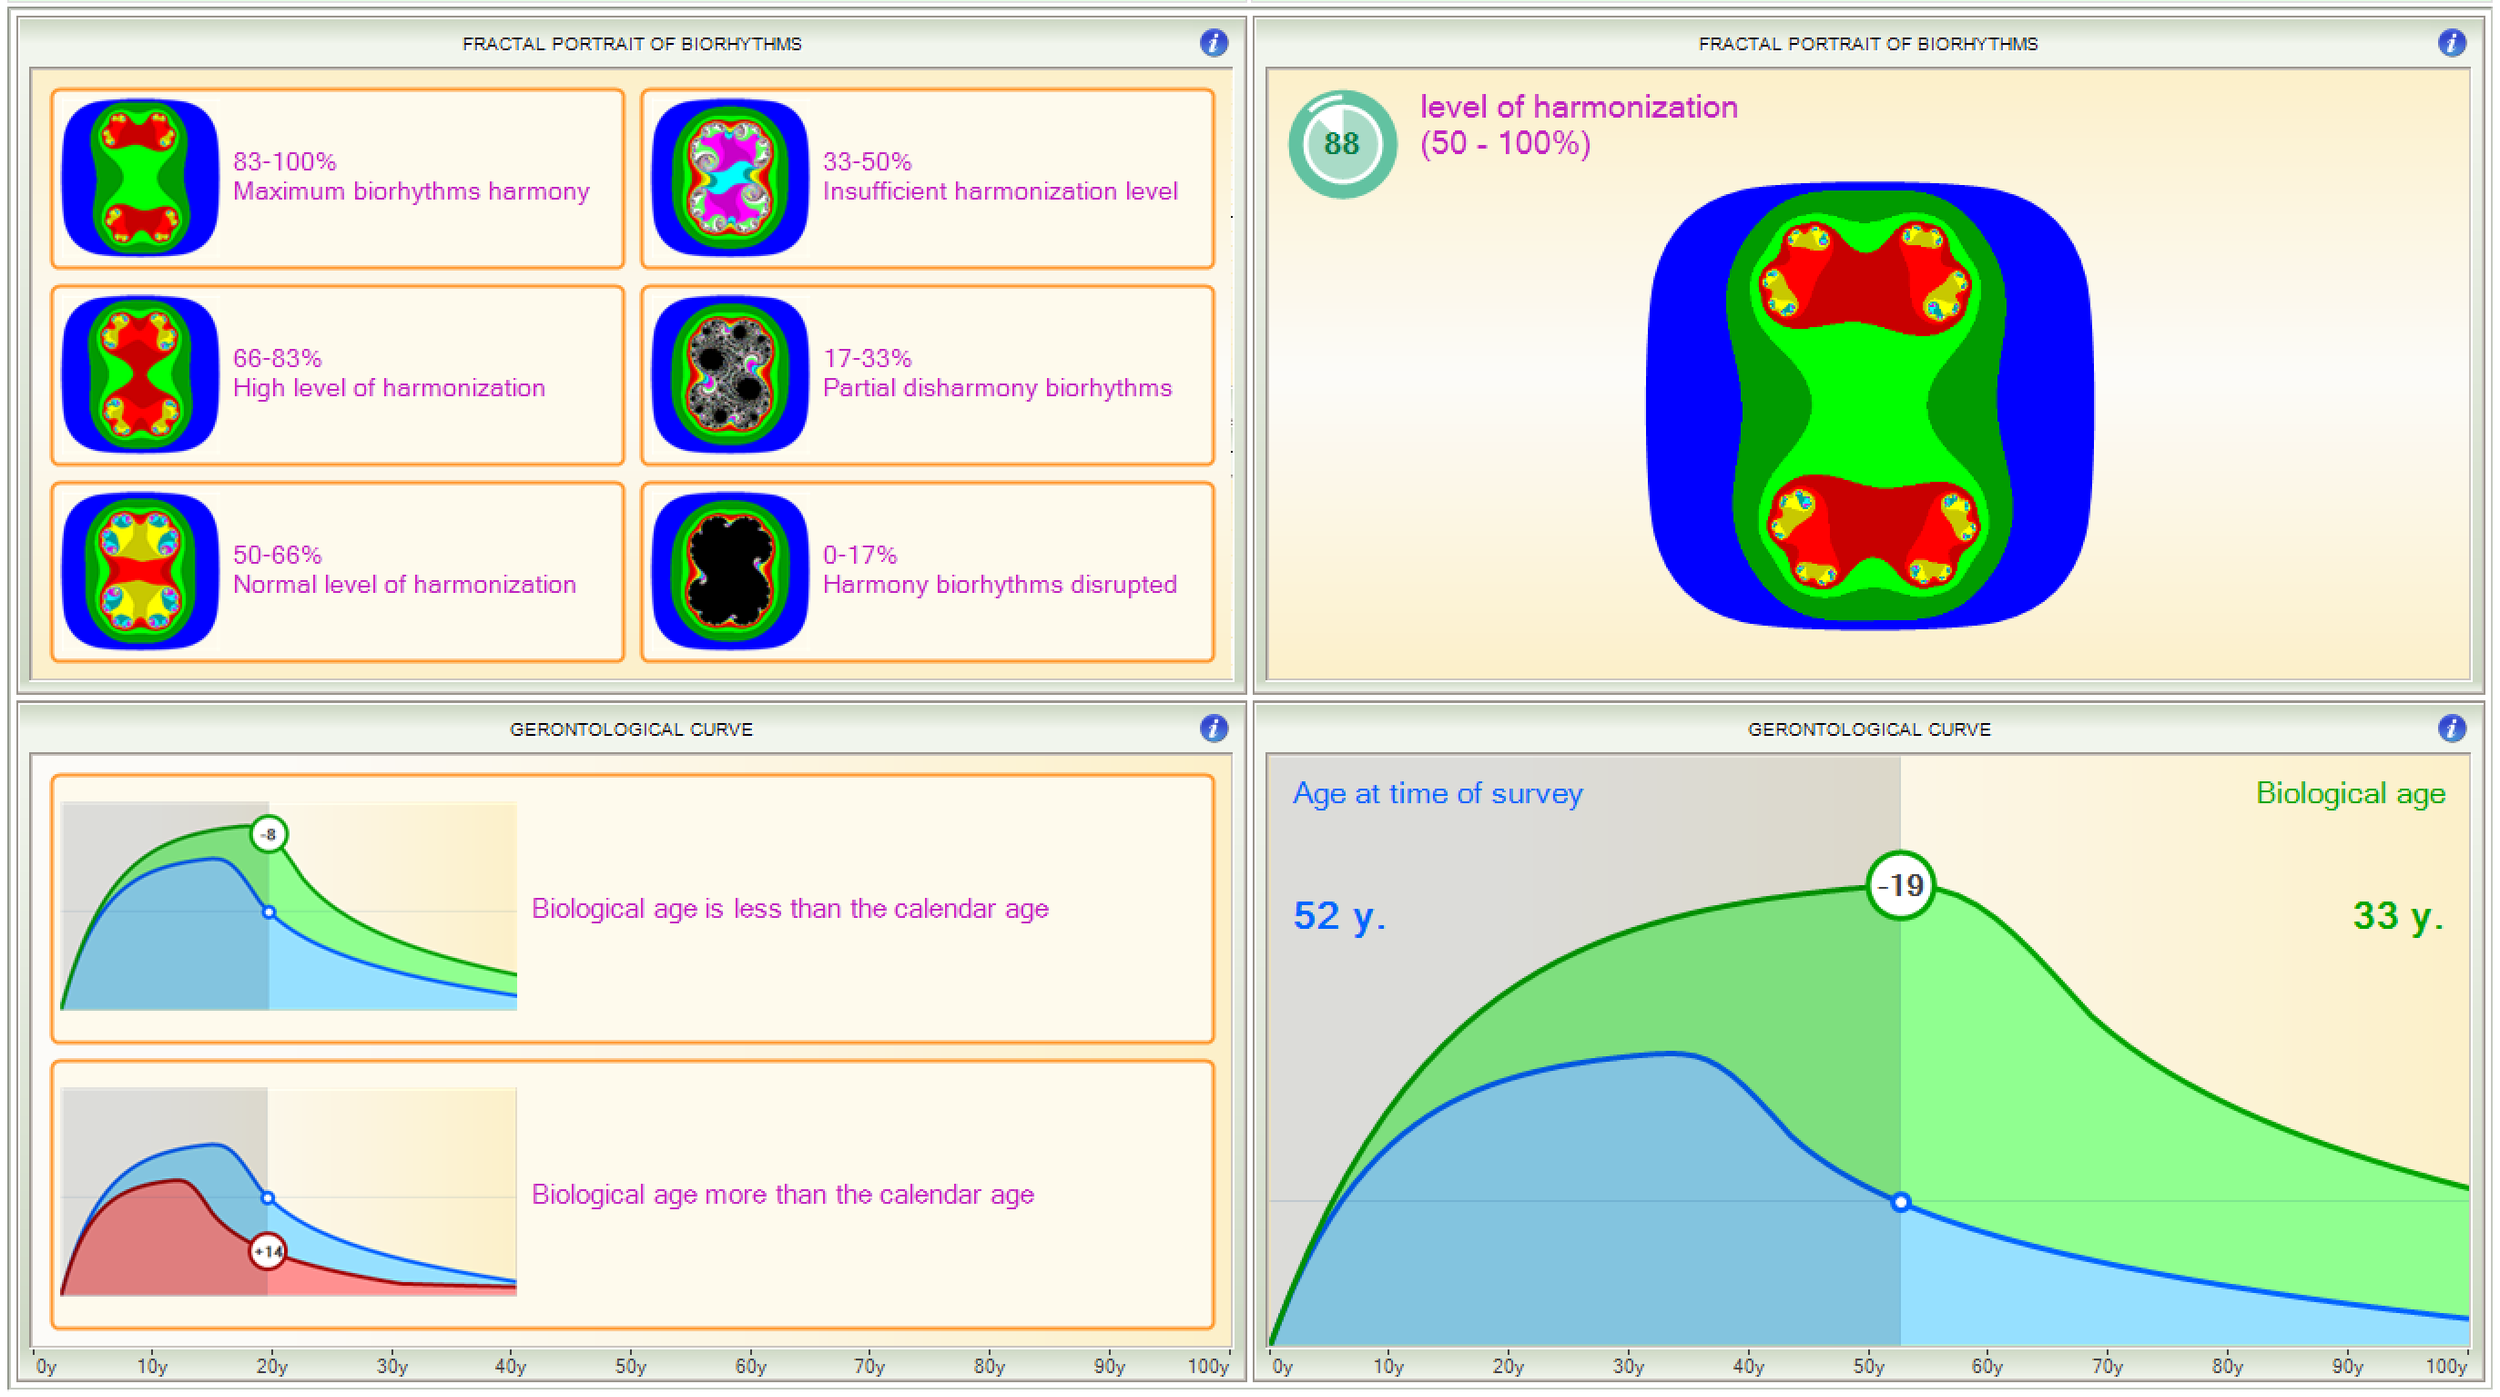
Biological Age- What is your true biological age? Are you older or younger than your current calendar age?
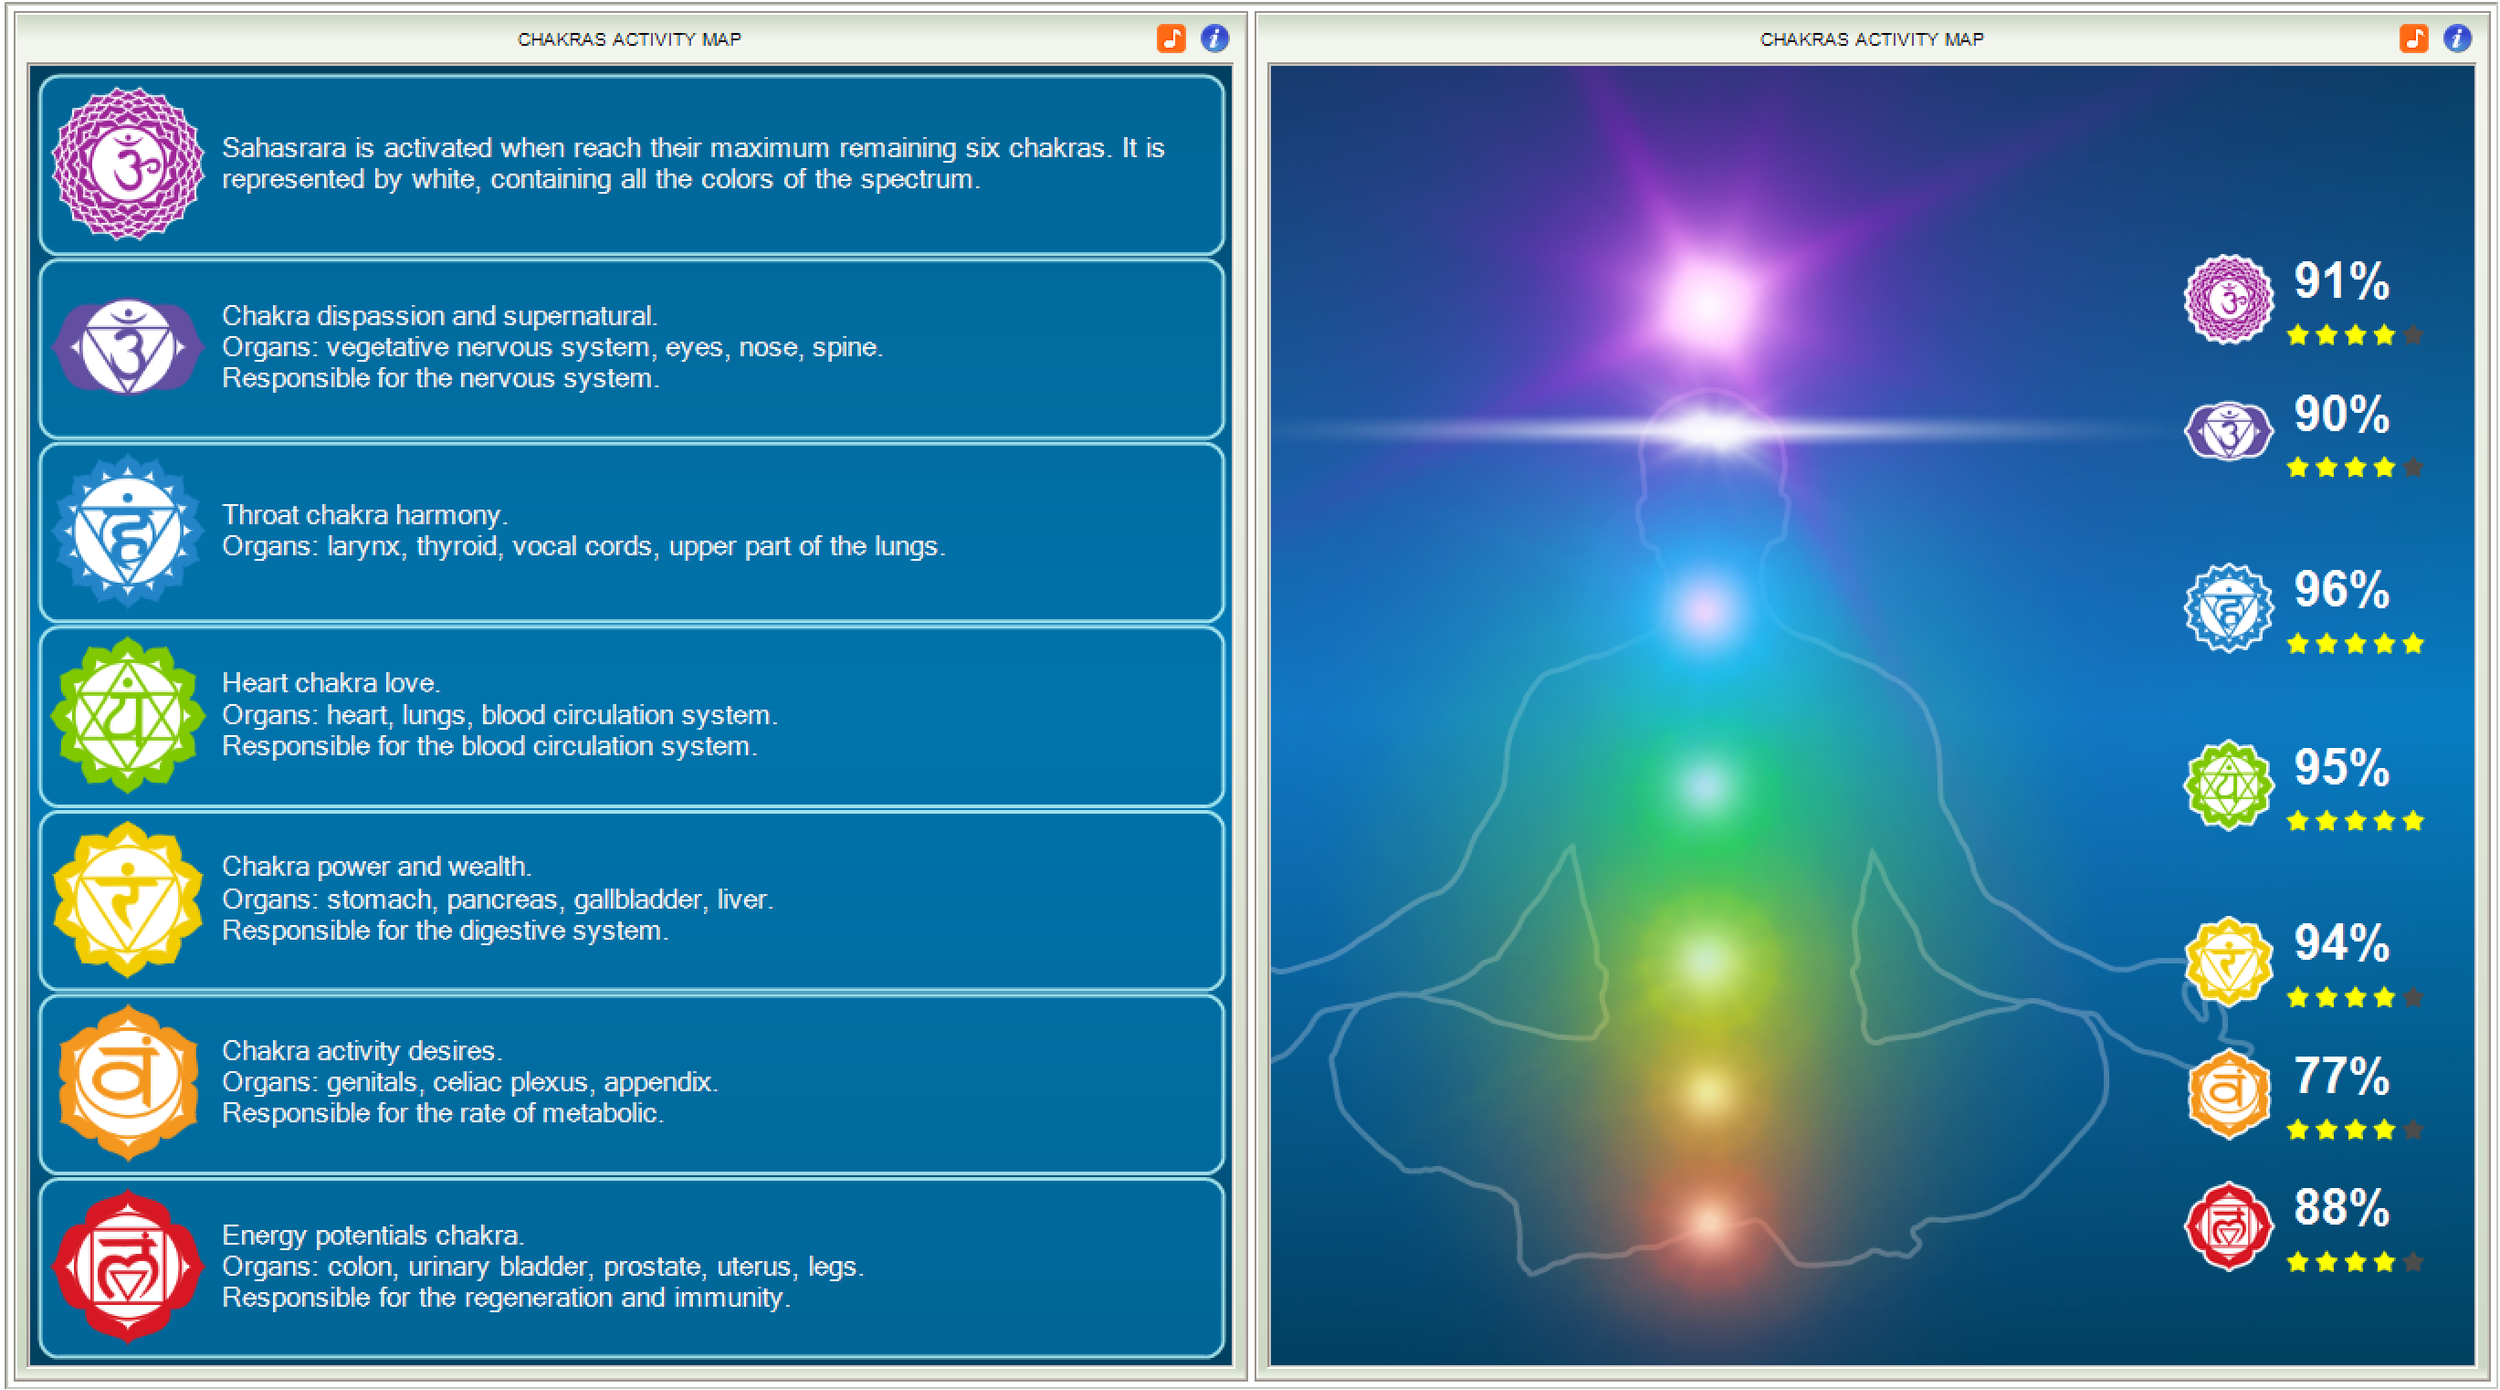
Charka Systems- Learn how your organs and emotions are performing within the chakra systems.
"Health is a state of complete physical, mental and social well-being, and not merely the absence of disease or infirmity."
– World Health Organization